Setting up monitoring with Grafana
I’ve been running different servers for about 10 years now, but I’ve never really had to set-up anything related to monitoring for my personal needs; in fact, I don’t need it right now.
Since I’m already working in some changes to my infrastructure like a adding a hub VM for working remotely, adding a new website, and updating other services, this time I also decided to include some monitoring. The idea first came when thinking about the analytics for this site.
No, I didn’t want to add any more scripts (like simpleanalytics.com) to this site as it’s meant to be lightweight. I only wanted to check how many requests and top visited paths (hello, goaccess). Anyways, I went all in to make use of nginx’s logs.
Took me a while to figure out, using Grafana, Loki, and Alloy, eventually it worked with nginx JSON logging. Now I have a dashboard with the different virtualhosts running in this server. It’s my first time setting up a Grafana instance from scratch, so I was a bit confused on how new datasources were ingested and creating the queries.
Eventually I figured out the problem wasn’t even my Alloy configuration, but how I didn’t know that I had to create a query (and basically choose which logfile to use) for data to start displaying. Besides that, reading the documentation and using Docker Compose made it straightforward.
I even took a few more minutes (not even 30) to set up Prometheus and connect it with my newly created Uptime Kuma.
I’m looking forward to adding more services and improving my infrastructure in the future. For now I’m just happy with my recent achievement and the experience I gained.
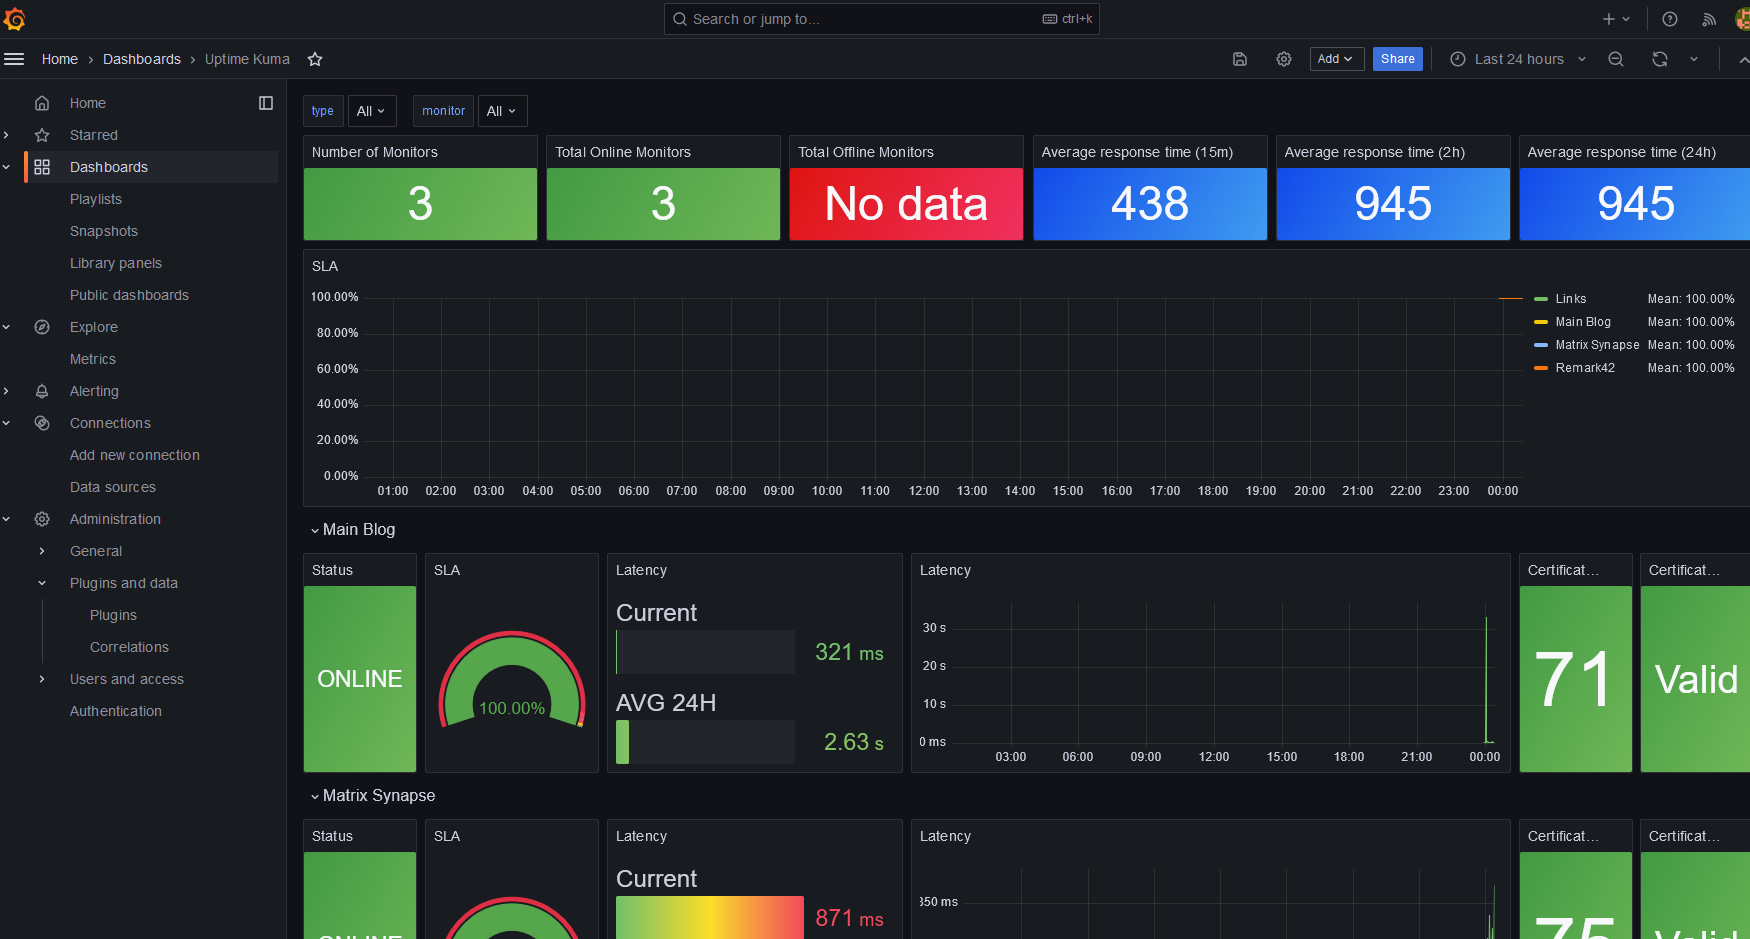
In less than 30 minutes with Prometheus, Uptime Kuma’s /metrics and a dashboard template.